To Do:
Code and other documents for this course will be in the github repository for Phys39.
Read the Overview. Introduction to arduino. Read the section on Hardware for temperature control (there are no exercises here). It contains a description of the setup with links to details about the components. Do the arduino tutorial.
- Write a sketch to measure the temperature. First, read the voltage across the thermistor. Compare the results with and without averaging the voltage over 100 measurements. Can you see the effect of averaging? Can you determine the digitization error? ChatGPT does an amazing job at writing this type of code. Use it.
- Next convert the averaged voltage to temperature using the thermistor equation.
- Set up a potentiometer that adjusts voltage between 0-5V. Measure the output on an oscilloscope. Hook up the voltage to an LED and dim and brighten the light.
- Set up a potentiometer that adjusts voltage between 0-5V. Convert the analog voltage to a digital signal. Use the digital signal to set the PWM levels so that 5V corresponds to 100% duty cycle and 0V to 0% duty cycle. Measure the PWM output on an oscilloscope. Use the PWM to control the intensity of the LED.
- Configure two of the PWM Arduino outputs to control the H-bridge. Use the computer to set the PWM. Measure the PWM output on an oscilloscope.
- Control the temperature of the TEC by wiring up the H-bridge. Use the arduino Serial Plot to monitor the temperature.
- Plot the steady state temperature (T) vs. the PWM setting for both heating and cooling. Use a minimum value of 10C and a maximum value of 45C. Use about 4 to 5 values for both heating and cooling (including PWM = 0). Calculate dT/dPWM for both heating and cooling.
- Explain the asymmetry in heating / cooling steps in the previous step. In other words, why is the magnitud of dT/dPWM different for heating and cooling?
- Write code to disable the PWM if the temperature exceeds 60C. The saftey bi-metal switch cuts off at 70C. This is a hardware kill switch that protects you and the equipment even if you screw up the code. The failsafe bi-metal switch has saved me from destroying the equipment many times.
- Send the data to Matlab via the serial port and plot it as a strip chart on Matlab. ChatGPT is very helpful. There is also code you can find on the web.
- Develop a GUI in Matlab to display and control the Arduino. This is easier said then done. ChatGPT let me down when I asked it for help. Maybe you will have better luck than me.

- An excellent article on Control Theory is Feedback for Physicists, by John Bechhoefer. Either read his 2005 Reviews of Modern Physics article up to the PID part, or purchase his 2021 book on Control Theory and read it to the PID section. You should buy the book - I did.
- Develop a PID. Start with P only. Vary the amplitude of P and observe the steady-state temperature. Find the amplitude at which the circuit becomes unstable. What is the period of the oscillation? Wiki and LabView have nice tutorials on PID.
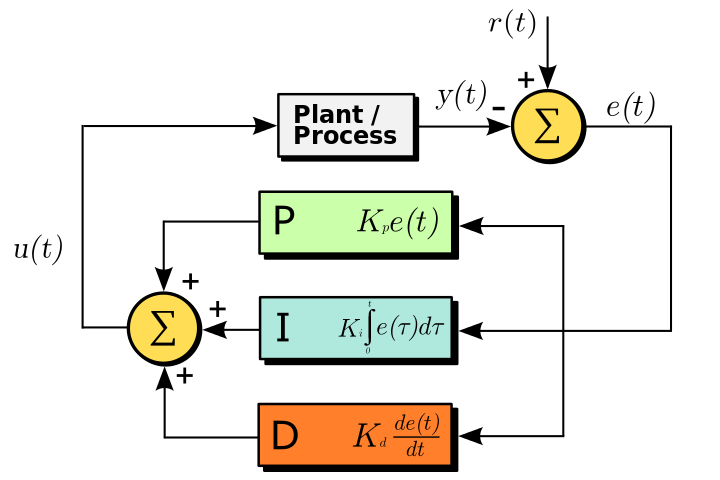
- Incorporate the I term and then the D term. Code it up according to the leftmost equation:

- Use error feedback (Figure 10.1a)

u is the control signal (i.e. power to TEC). r is the set-point temperature. y is the measured temperature. e = r - y is the error.
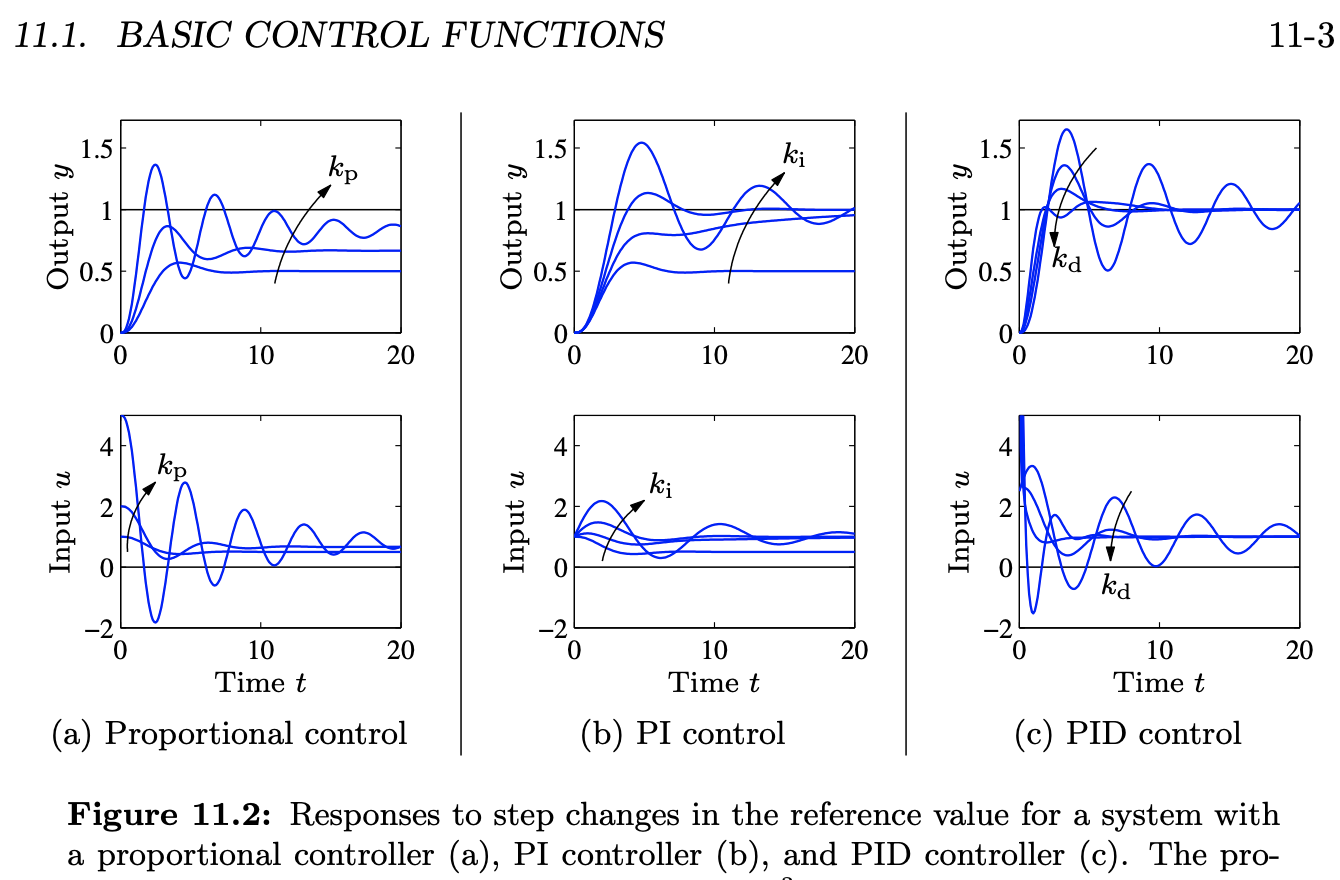
- Characterize the response of your system as a function of the feedback parameters for P and P/I control. Measure 3 values for P-only control. Use the Goldilocks Principle; too little, just right, and too much. Do the same for P/I control where you vary the gain of the integral term with the proportional gain constant. Make plots from your setup for the output (temperature) and input (PWM value). The plots should resemble page 11-3 of Astrom and Murray in the chapter on PID theory, pictured below. They have a website for the book. This is pretty advanced stuff. Don't bother with PID control.

- Use Matlab to build a mathematical model of the Process - y(t) - in figure 10.1a. This is the TEC itself plus aluminum block with the thermistor embedded inside. Combine the PID model of eqn 10.1 with the model of the process. Compare experiment with theory.
- Incorporate anti-windup if you haven't already done so. Compare with and without this feature.
- Use the Ziegler-Nichols tuning rules with the step response (sec. 4.1) AND frequency response (sec. 5) method to tune the parameters.
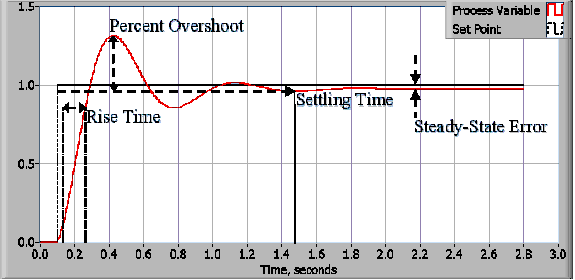
- Systematically characterize the response of the system to steps in temperature using the four attributes indicated in the plot below plus, when there are oscillations, also characterize their period. Further reading from LabView on PID. Vary the initial and final temperatures of the steps. Step in both directions.

- Redo the project using an Arduino PID library.
Example write up of PID temperature control from a different university.
Example write up of lab from S2010, physics 39.
Example write up of lab from S2012, physics 39.
Example write up of lab from F2023, physics 39.
return


